
by stephy | Mar 8, 2026 | PowerPoint, Presentation
If you’ve already learned how to make a vertical lollipop chart, you might think, “Cool. I’ll just rotate it 90 degrees.” Nope. You can’t rotate charts in PowerPoint. (I know, it’s incredibly silly.) So we build the horizontal version differently. This one uses...
by stephy | Mar 1, 2026 | PowerPoint, Presentation
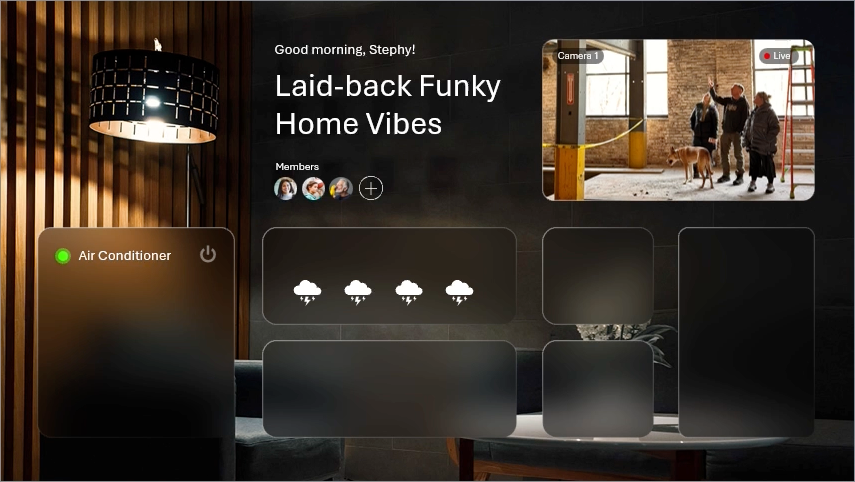
The “liquid glass” effect is everywhere right now — frosted panels, soft blur, subtle highlights that look like light is hitting curved glass. PowerPoint doesn’t have a “blur background” button but we can fake it. This effect works because PowerPoint allows you...
by stephy | Feb 24, 2026 | Google Slides, PowerPoint, Presentation, tutorial
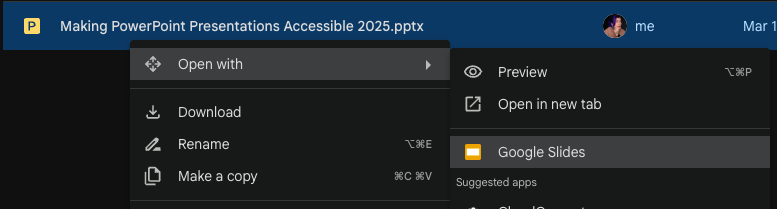
So you’ve got a PowerPoint file… but you need it in Google Slides. Maybe your team lives in Google Workspace. Maybe you need real-time collaboration. Maybe you’re just trying to survive. The good news: converting a PowerPoint to Google Slides is easy. The bad news:...

by stephy | Feb 17, 2026 | PowerPoint, Presentation, tutorial
PowerPoint isn’t just for rectangles and sad little circles. Hidden inside it is a set of tools that lets you build completely custom shapes by combining two (or more) shapes together — kind of like “pathfinder” in Illustrator. PowerPoint calls these the Shape...

by stephy | Feb 10, 2026 | PowerPoint, Presentation, tutorial
If your first instinct when you have data is to insert a pie chart…don’t worry. You’re not alone. But pie charts are almost never the best choice, especially when you have more than 3 data points. They’re hard to compare, hard to read, and they make your audience work...

Recent Comments